
from Prof. Avishai Mandelbaum’s TAU course:
On Mining the Structure of a Service Process: Data Graphs (Static) and Data Networks (Dynamic)“SEELab researchers import data from service systems (our SEEpartners), and then prepare it for research and teaching. This is a tedious meticulous process that starts with understanding the data (lots of back-and-forth with the data originator), cleaning the data (e.g. correcting erroneous or managing missing measurements), and finally harnessing the data so that it conforms to SEELab schemas. The data is then ready for EDA, as you did when working through the SEEStat Tutorial – but this was only the very start of an EDA journey.
Indeed, your SEEStat experience involved the mining of isolated elements within a full picture, namely that of a service process. We refer to such elements as primitives or building-blocks, which includes daily-arrival rates, histograms of service-durations, and hazard rates of customer’s impatience; you encountered also examples of primitives that we called protocols (of routing or scheduling), for example routing to an inter-queue, or dynamic priorities while waiting for a phone service, or the discharge process at an internal ward of a hospital.
Process Times, States and their Resolutions: A Process is always dynamic – it thus evolves in time while occupying or changing states. To measure or describe a process, one must therefore specify its time- and state-resolutions, possibly multiple for each. (Consider a hospital ward for example: time could be measured in days or hours which, as you saw, yields very different depictions and hence information; and a component of the ward state is its occupancy, which could be the number of occupied beds, or their (more aggregated) fraction out of total, or (more refined) associating with each occupied bed also a clinical marker of its patient or even its nurse-in-charge.)
Rich as they are, the above primitives do not fully characterize a service-process – still lacking is a skeleton, or process structure that connects and relates primitives to each other, and the present second tutorial will take you through examples of such structures.”
-
 SEEGraph Tutorials here
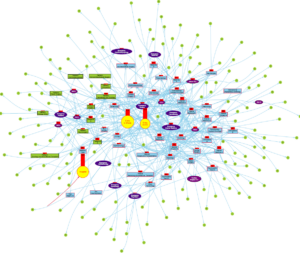
HomeHospital data, SFDP layout, State animation type
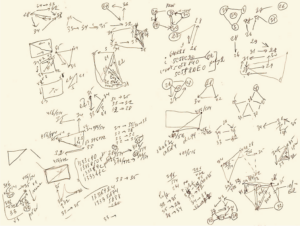
Valery’s working notes from SEE Graph project
SEELab software applications include a variety of graphs-related algorithms that support graph creation, EDA, and layout algorithms, which are required for graph and network drawing. Specifically, these includes
- SEEGraph (Designer) that supports mining of graph-structure (sub-structures) from databases. This is a prerequisite for the next phase, which is carried out by
- SEEGraph Viewer, which visualizes graphs and data-animations; the prerequisite for visualization is the graph-layout algorithm
SEEGraph (Designer) library includes four algorithms to create process flow animation:
-
- Flow animation, displaying movement of customers / patients as a flow of points;
- State animation displaying the quantity of customers / patients as rectangles of various heights; abnormal cases like wait time exceeding the threshold are marked by different color;
- Time animation displaying dynamically the graph structure by changing the width of edges according to frequencies of flow and invalidating nodes and edges, which are not active in the given time interval;
- Hybrid animation, displaying a combination of the flow and state
The SEEGraph Viewer displays graphs in a user-friendly fashion (now available for a limited audience, through the SEELab server).